ResearchHub Intelligence logoResearchHub Intelligence
Data, analysis, literature and posters in one workspace

Run your entire research project in one place

ResearchHub takes you from a field sample to a finished conference poster — worksheets, statistics, graphs, literature, citations and an AI assistant that works from your own data.

Built for students, supervisors and labs across biology, chemistry, engineering and beyond

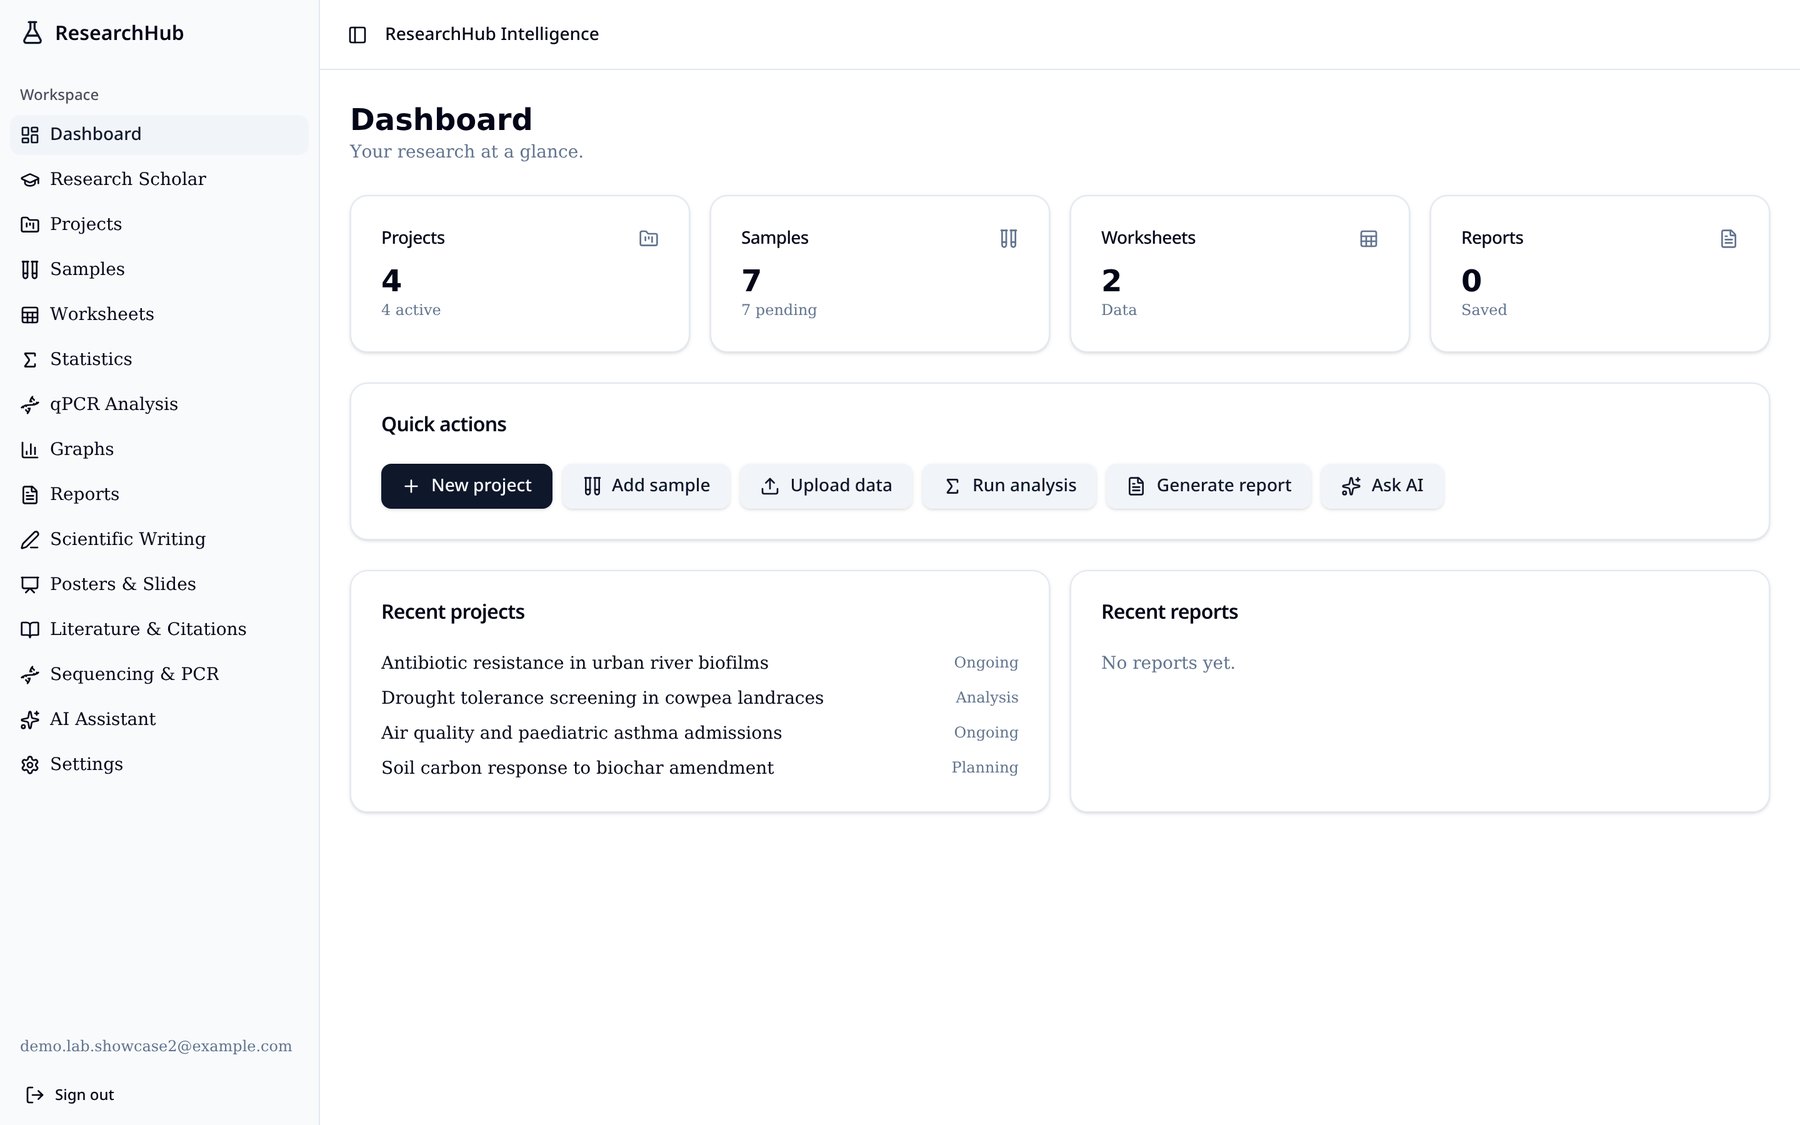
ResearchHub dashboard showing active projects, sample counts, worksheets and recent research activity
Your dashboard: active projects, samples logged, worksheets and recent activity at a glance.
Undergraduate and postgraduate students
Supervisors and principal investigators
Teaching and research labs
Field and environmental teams

How it works

One clear workflow, from your first sample to the file you submit.

  1. 1. Create your project

    Record the objective, hypothesis, supervisor and timeline.

  2. 2. Log your samples

    Sample codes, types, locations, storage and processing status.

  3. 3. Add your data

    Type it in, or import a CSV or Excel worksheet linked to the project.

  4. 4. Run the analysis

    Descriptive stats, t-test, ANOVA, correlation, regression or qPCR.

  5. 5. Make the visuals

    Charts, statistical plots and scientific figures from your own data.

  6. 6. Write and export

    Report, abstract, poster or slides — exported to PDF, Word or PowerPoint.

Everything a research project needs

Stop stitching together spreadsheets, reference managers, stats packages and slide decks.

Projects

Every project, sample and result in one workspace

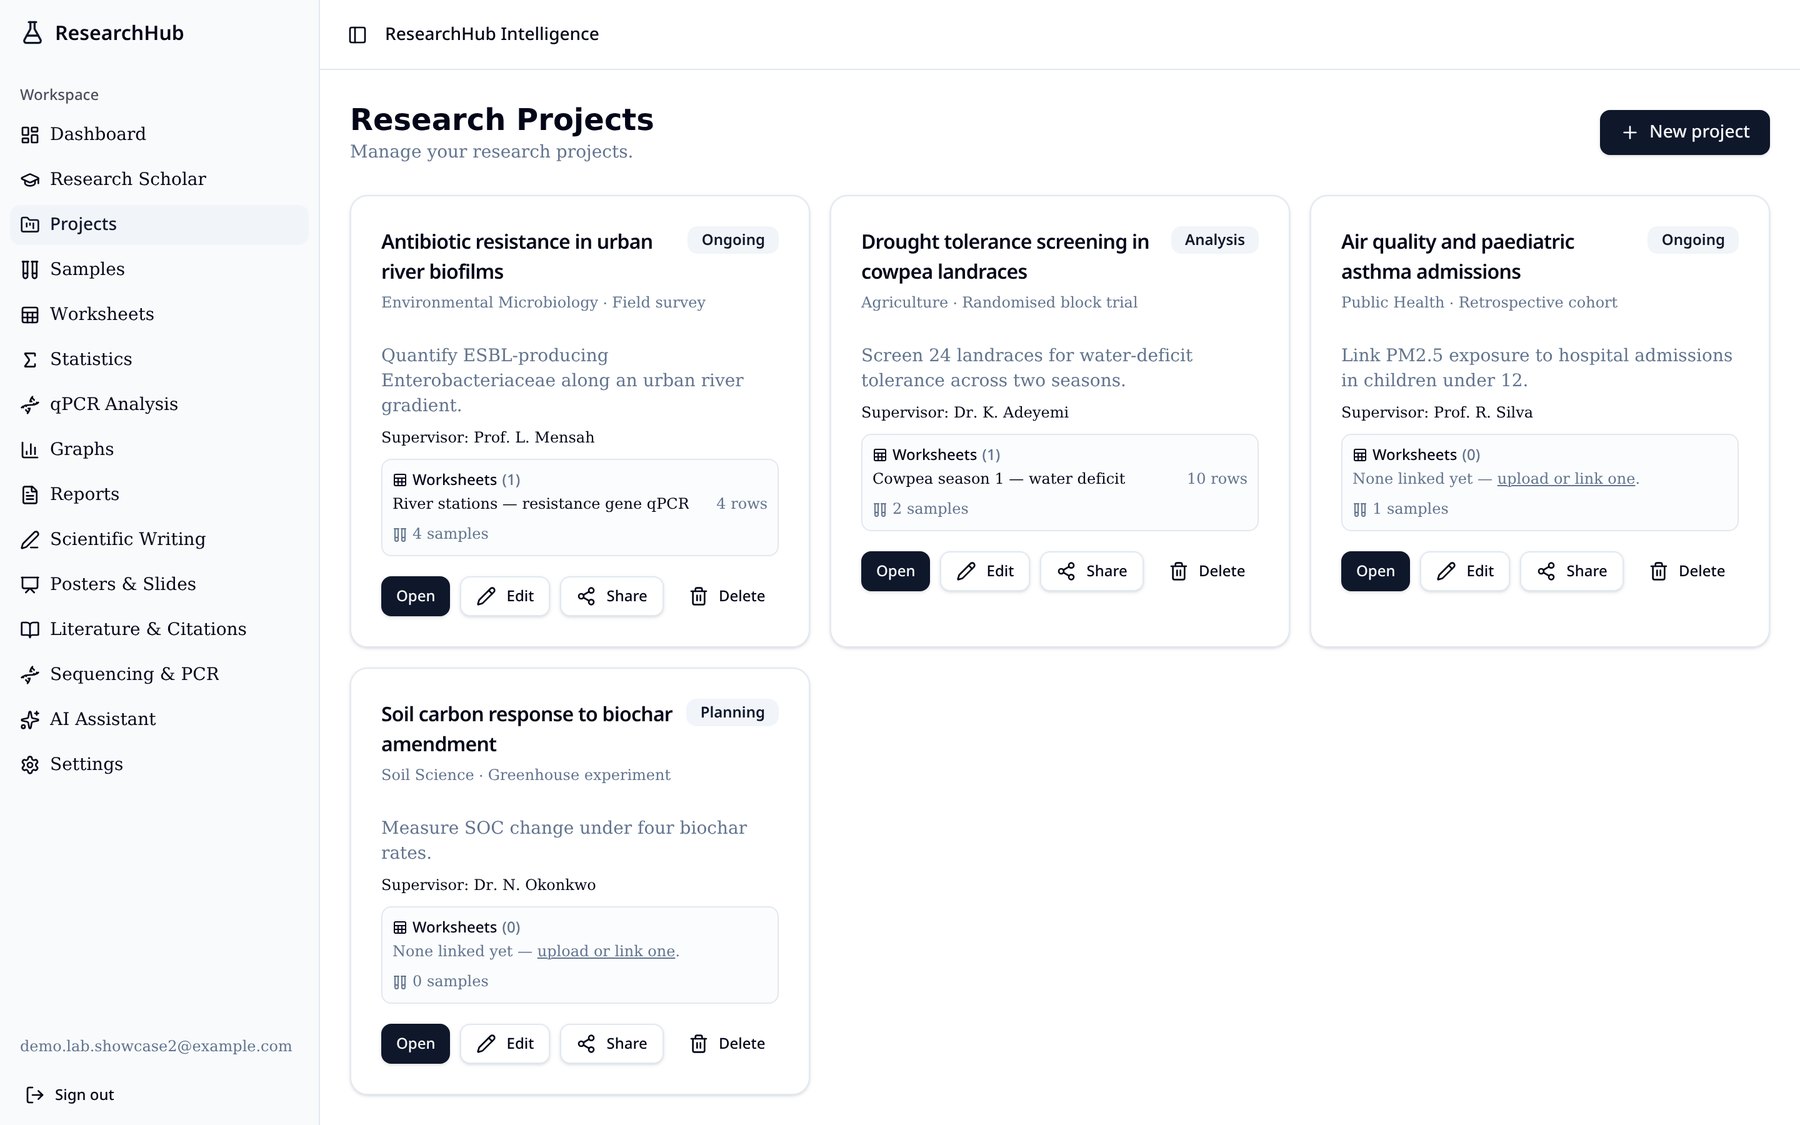
Give each study a home: objective, hypothesis, timeline, status, linked worksheets and a full sample register with GPS coordinates and processing state.

  • Project workspace with linked data
  • Sample register with GPS + status
  • Invite supervisors and collaborators
ResearchHub projects page listing research projects with linked worksheets and sample counts
Worksheets

Spreadsheet data entry that talks to your analysis

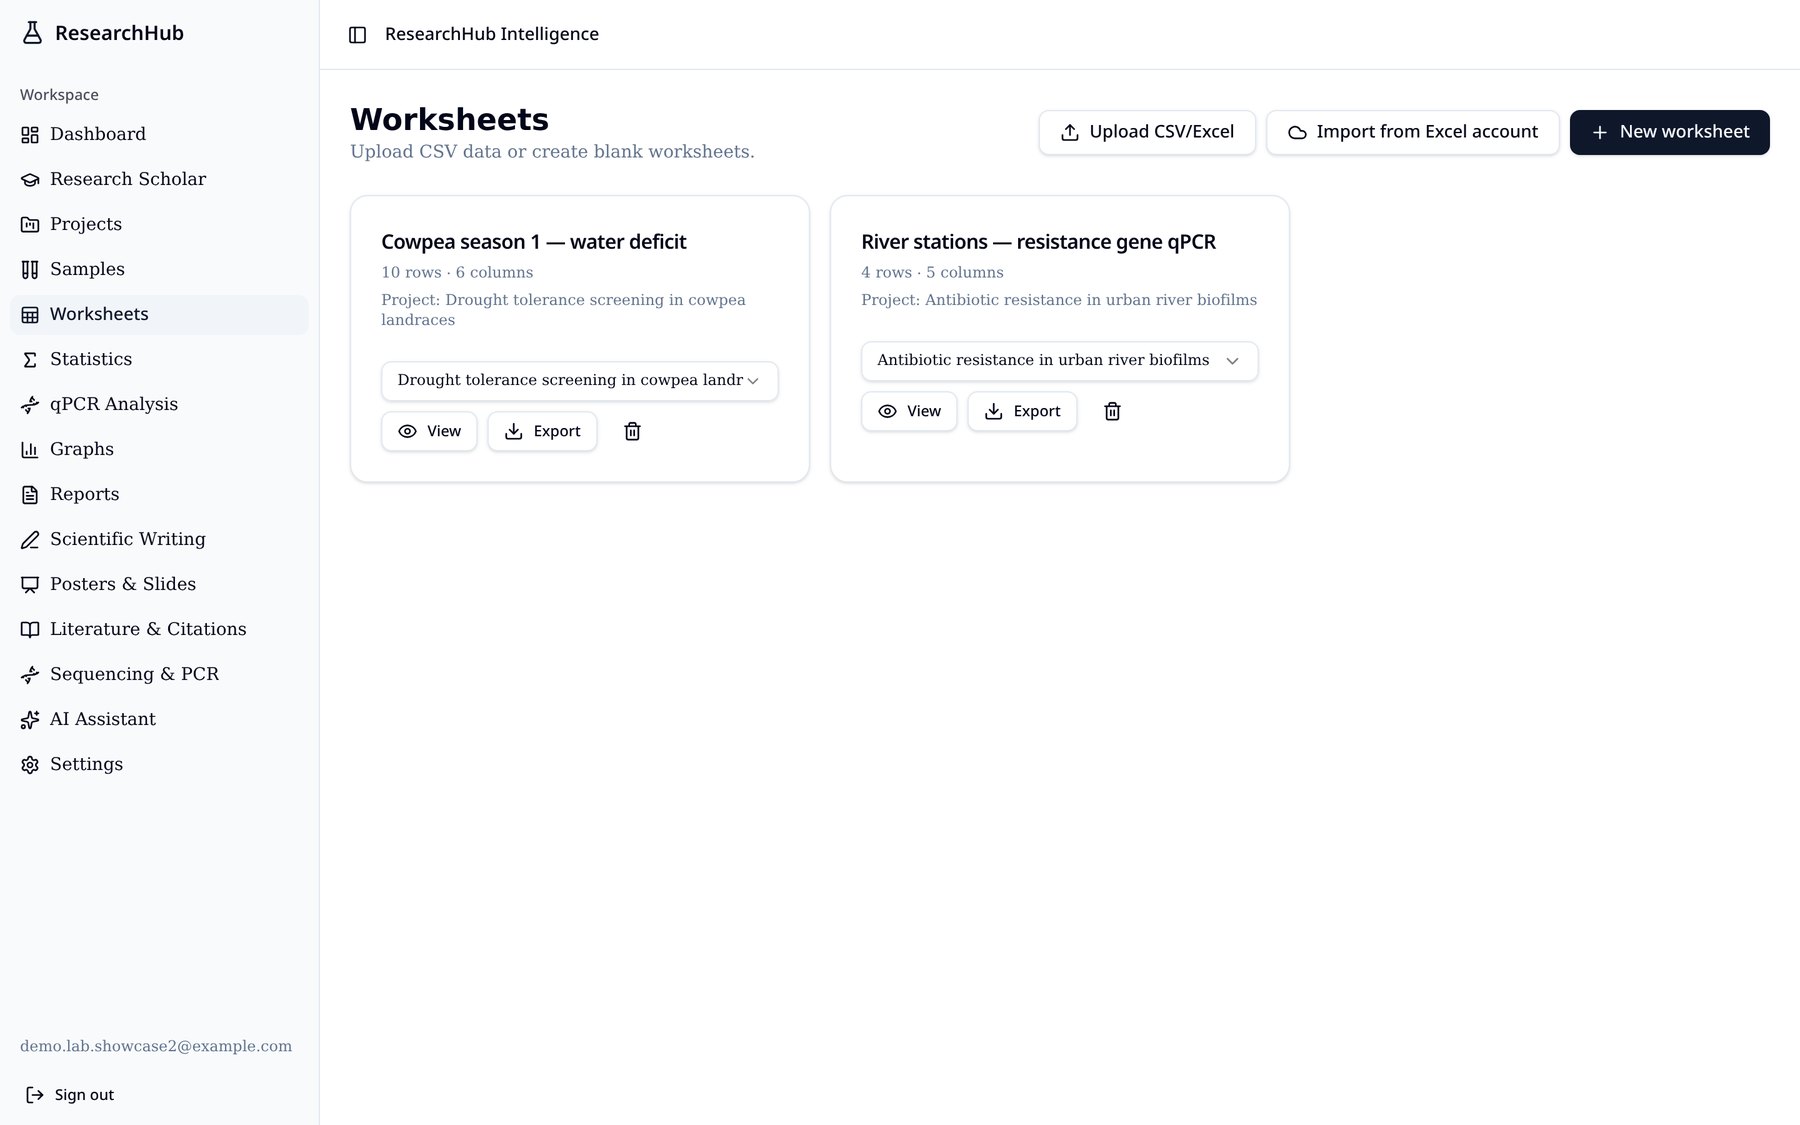
Type data directly, import CSV or Excel — including straight from your connected Excel account — and every worksheet is instantly available to statistics and graphs.

  • CSV and .xlsx import with sheet picker
  • Link worksheets to a project
  • Export clean data any time
Worksheet editor in ResearchHub showing tabular research data with import and export controls
Statistics & graphs

Run the test, then publish the figure

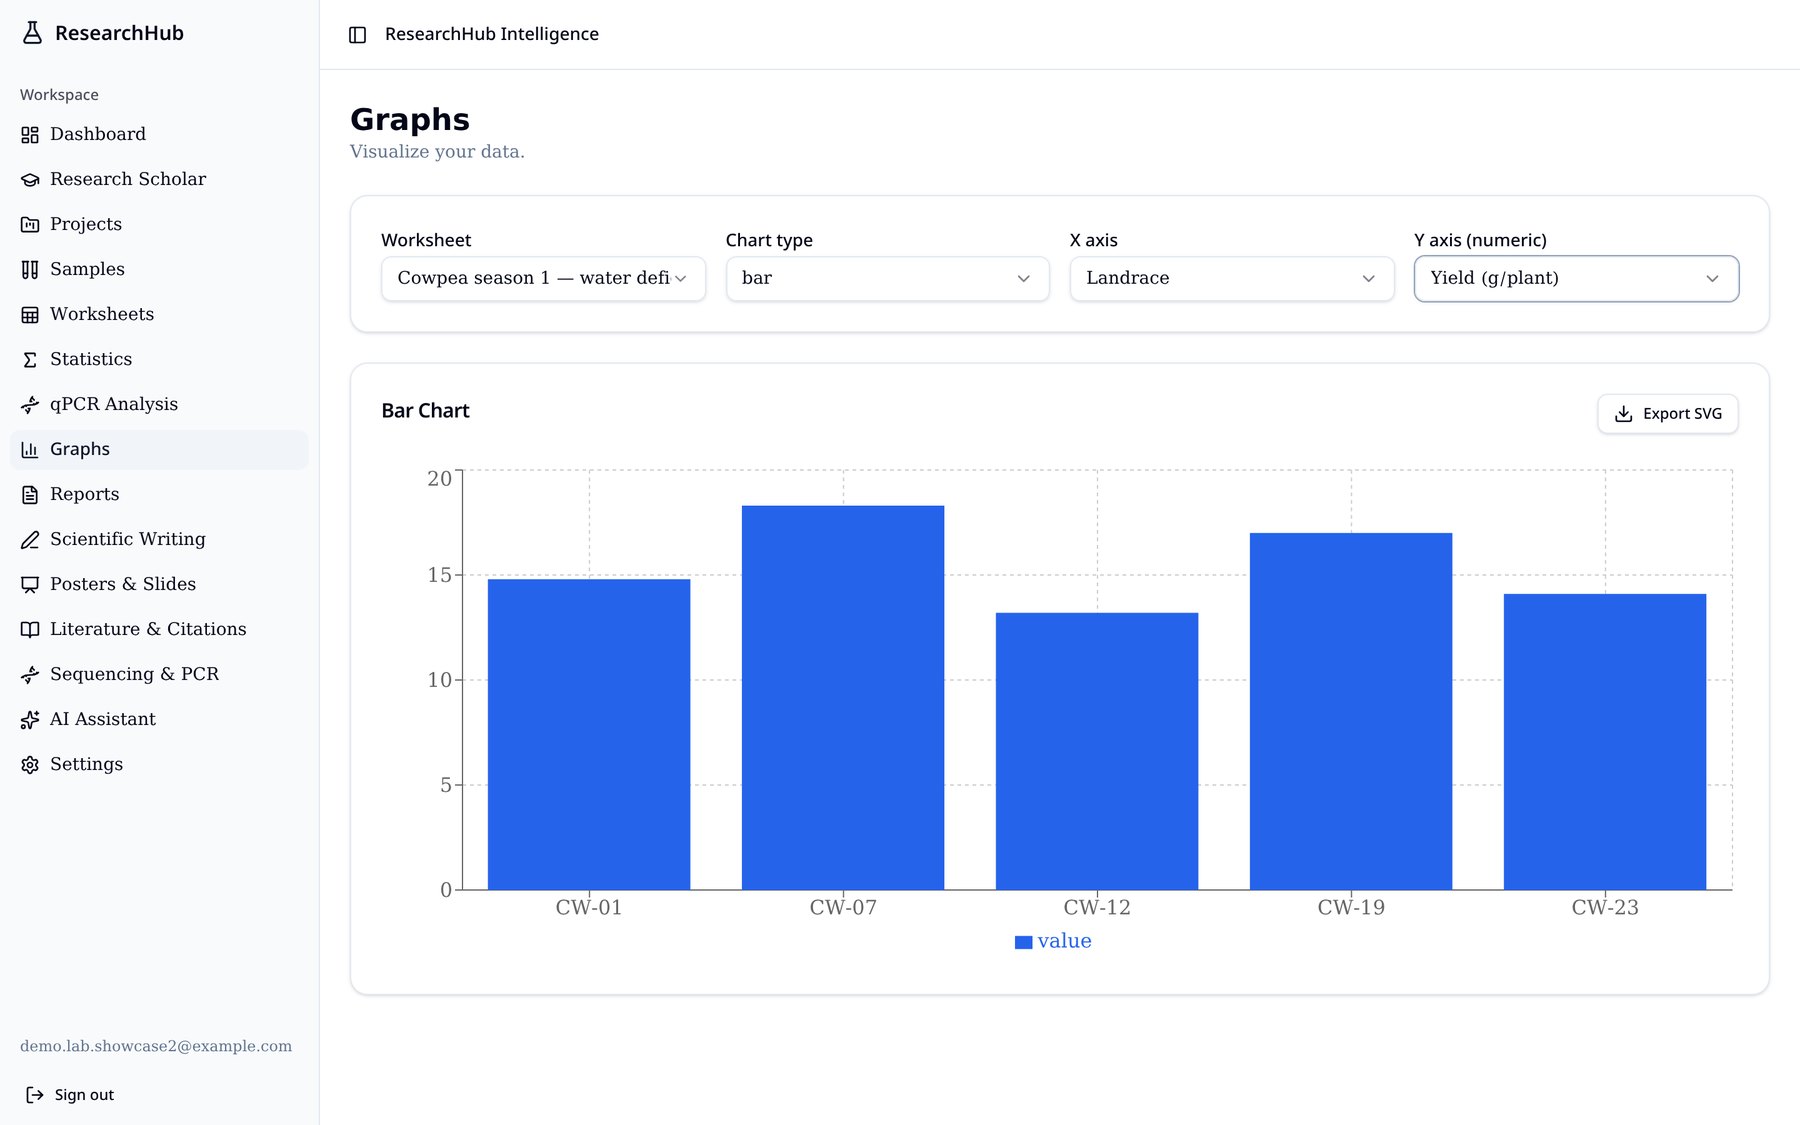
Descriptive statistics, t-tests, ANOVA and regression on your own worksheets, then turn any two columns into a publication-ready chart you can export as SVG.

  • t-test, ANOVA, correlation, regression
  • Bar, line, scatter and pie charts
  • SVG export for manuscripts
Bar chart of cowpea yield by landrace generated from a worksheet in ResearchHub
Literature & citations

Find real papers and cite them correctly

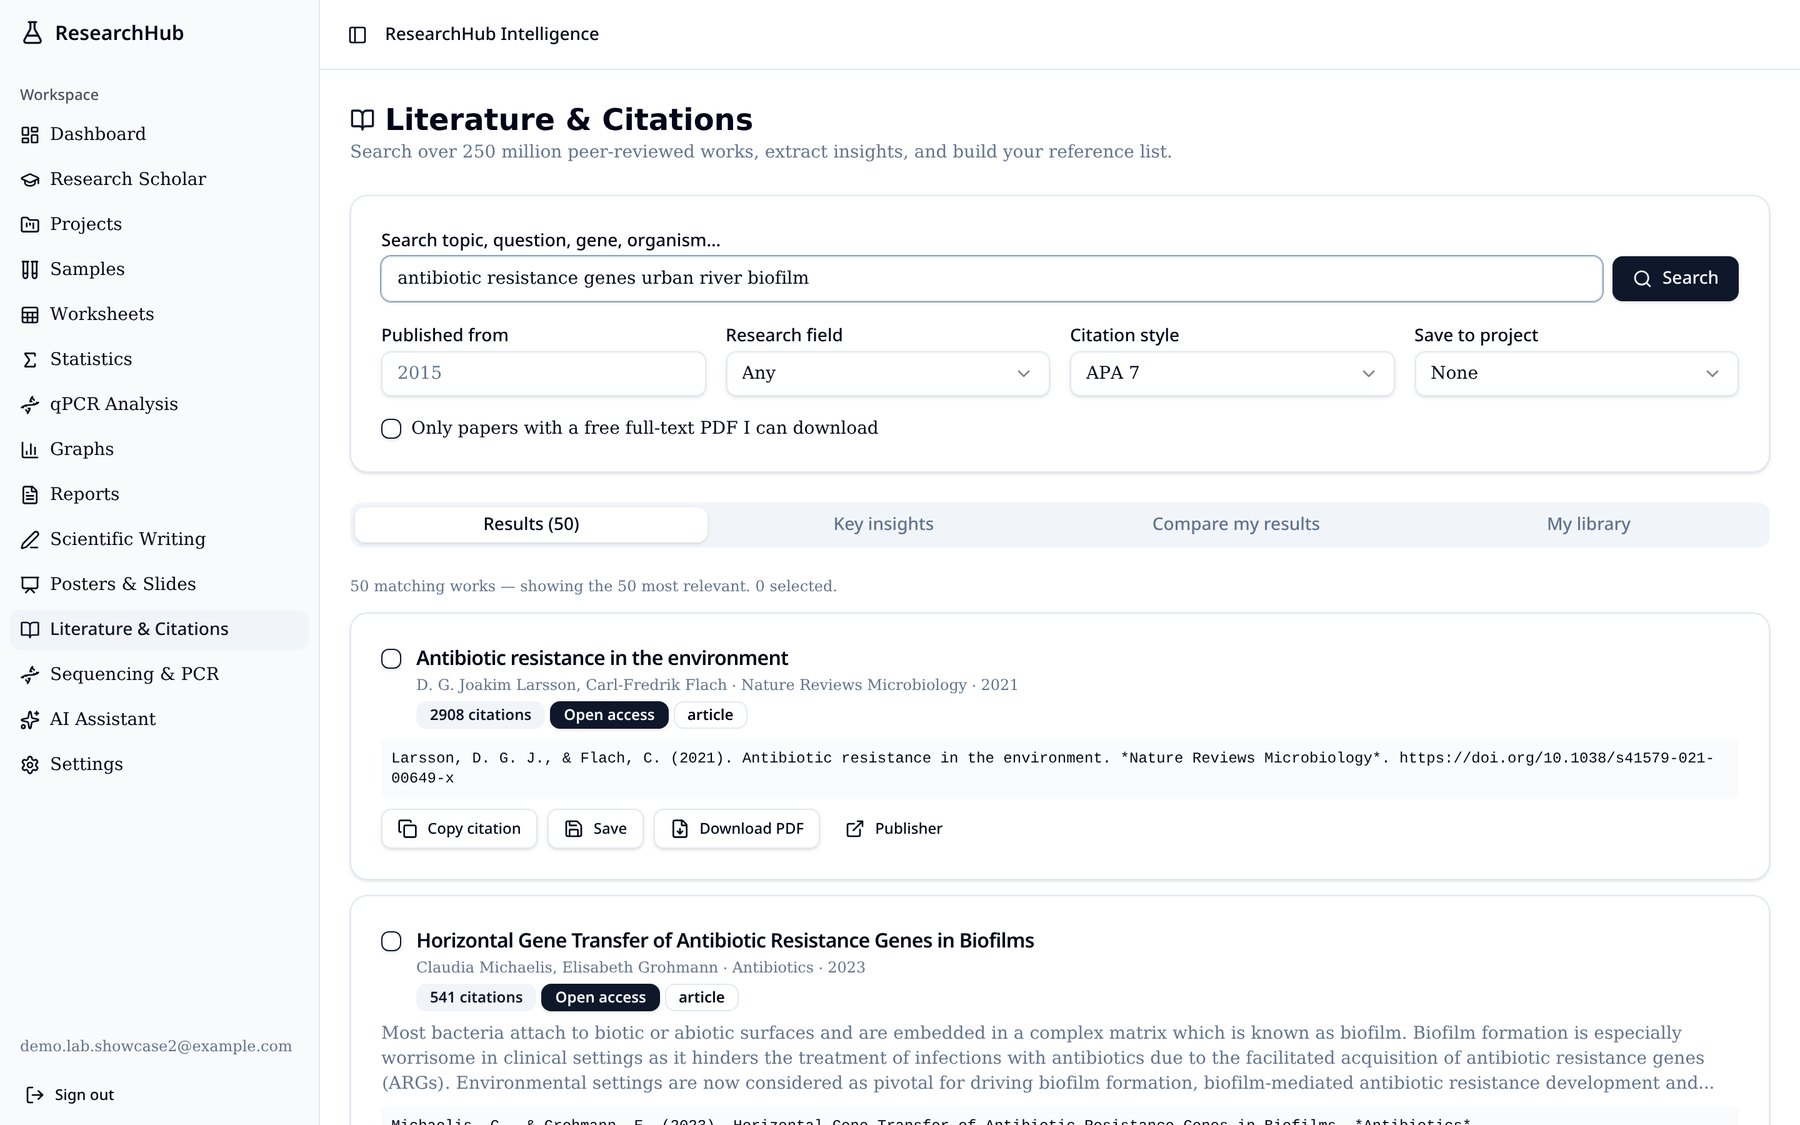
Search over 250 million peer-reviewed works, filter to open-access PDFs you can actually download, and save references formatted in APA, Vancouver, Harvard, MLA, IEEE and more.

  • Open-access PDF filter
  • AI key insights across selected papers
  • One-click bibliography export
Literature search results in ResearchHub with citations and open-access download buttons
Posters & slides

Conference-ready posters, not plain text boxes

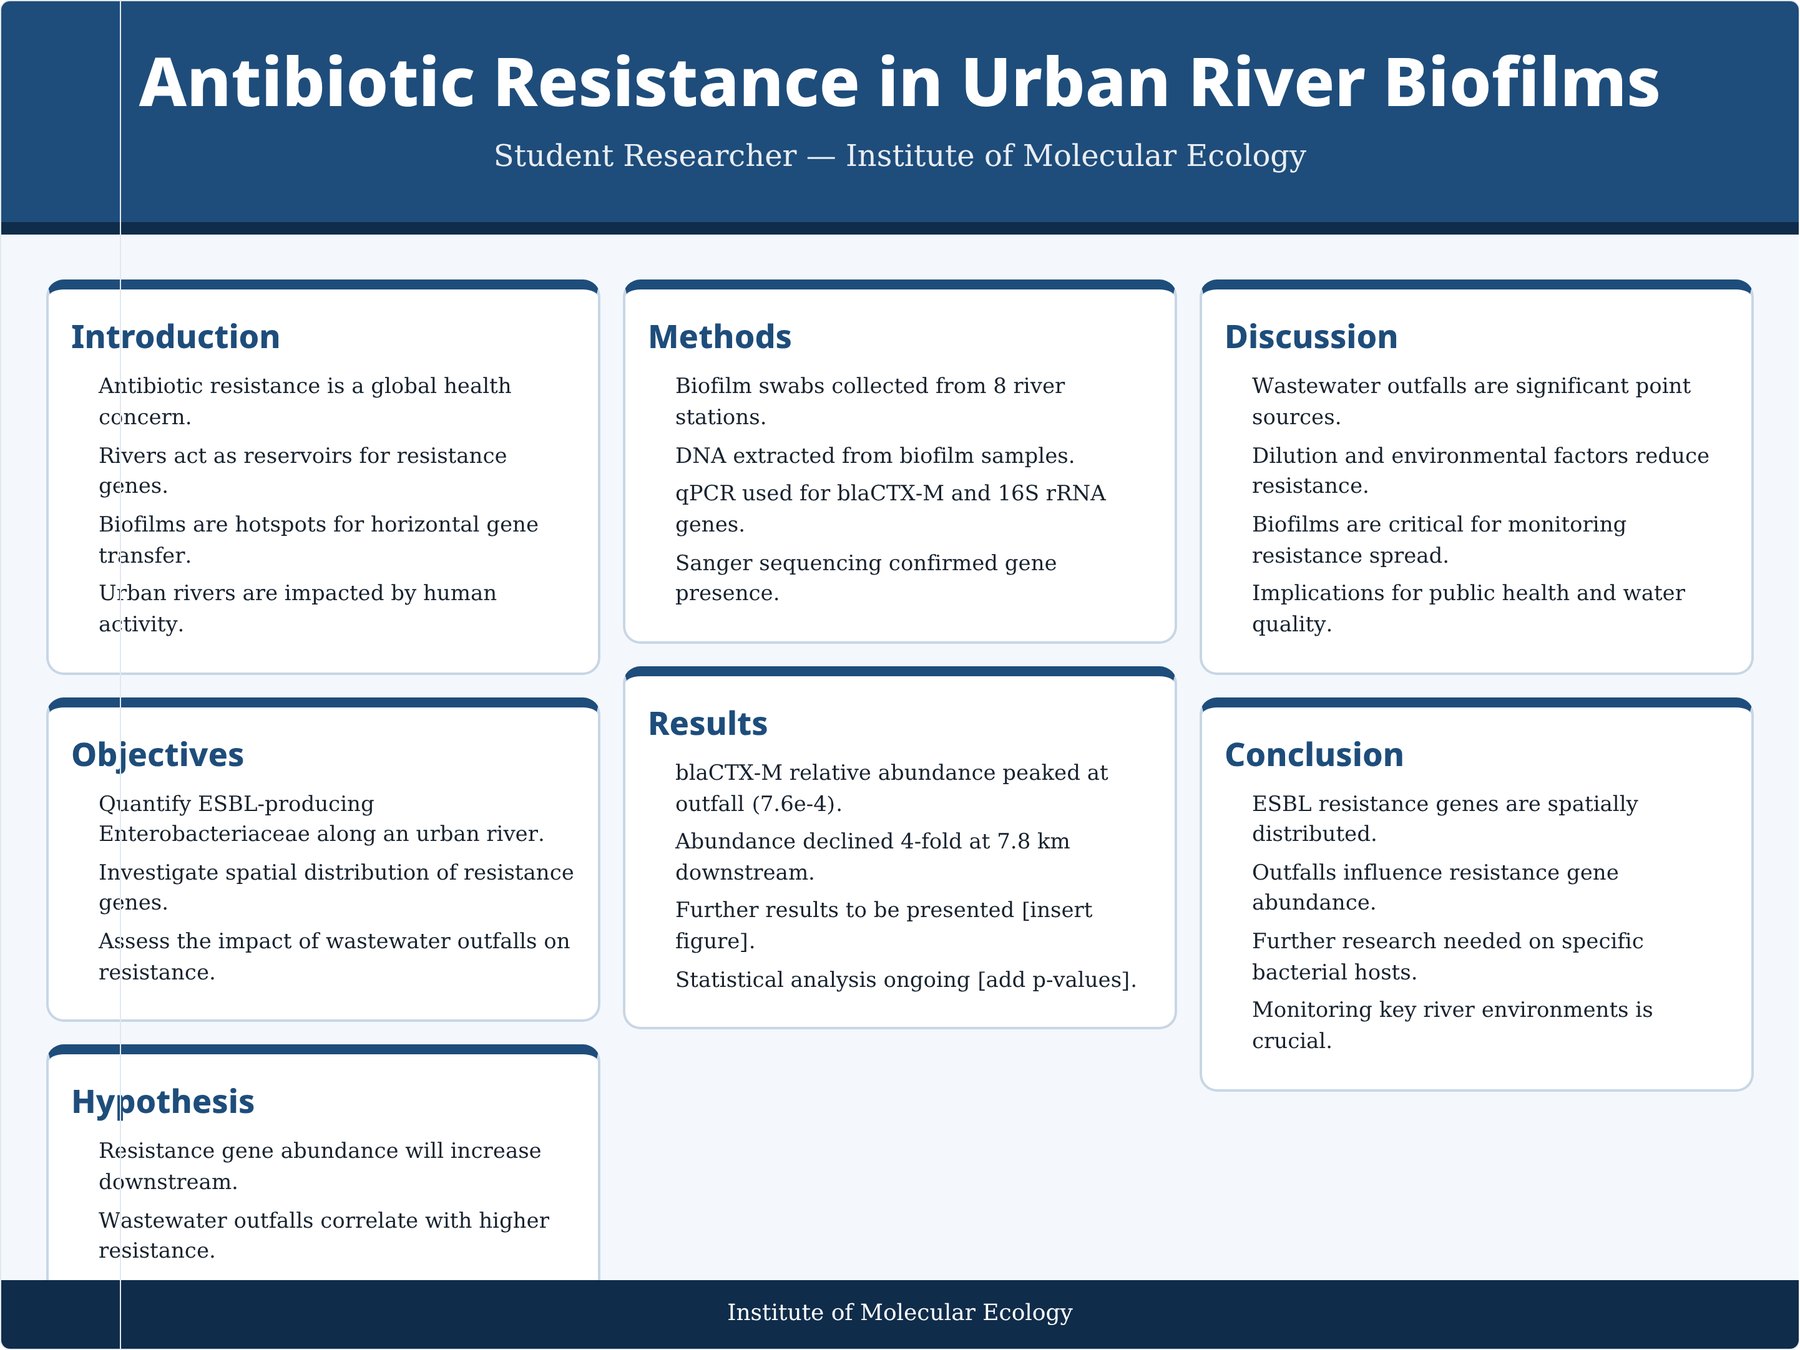
Generate a poster or slide deck from your project, style it with themes, fonts and column layouts, and download a PowerPoint that looks exactly like the live preview.

  • Six colour themes and font pairings
  • WYSIWYG poster and slide preview
  • PowerPoint, Markdown and Canva-ready export
Conference poster preview generated in ResearchHub with introduction, methods, results and conclusion panels
AI assistant

A research assistant that refuses to invent data

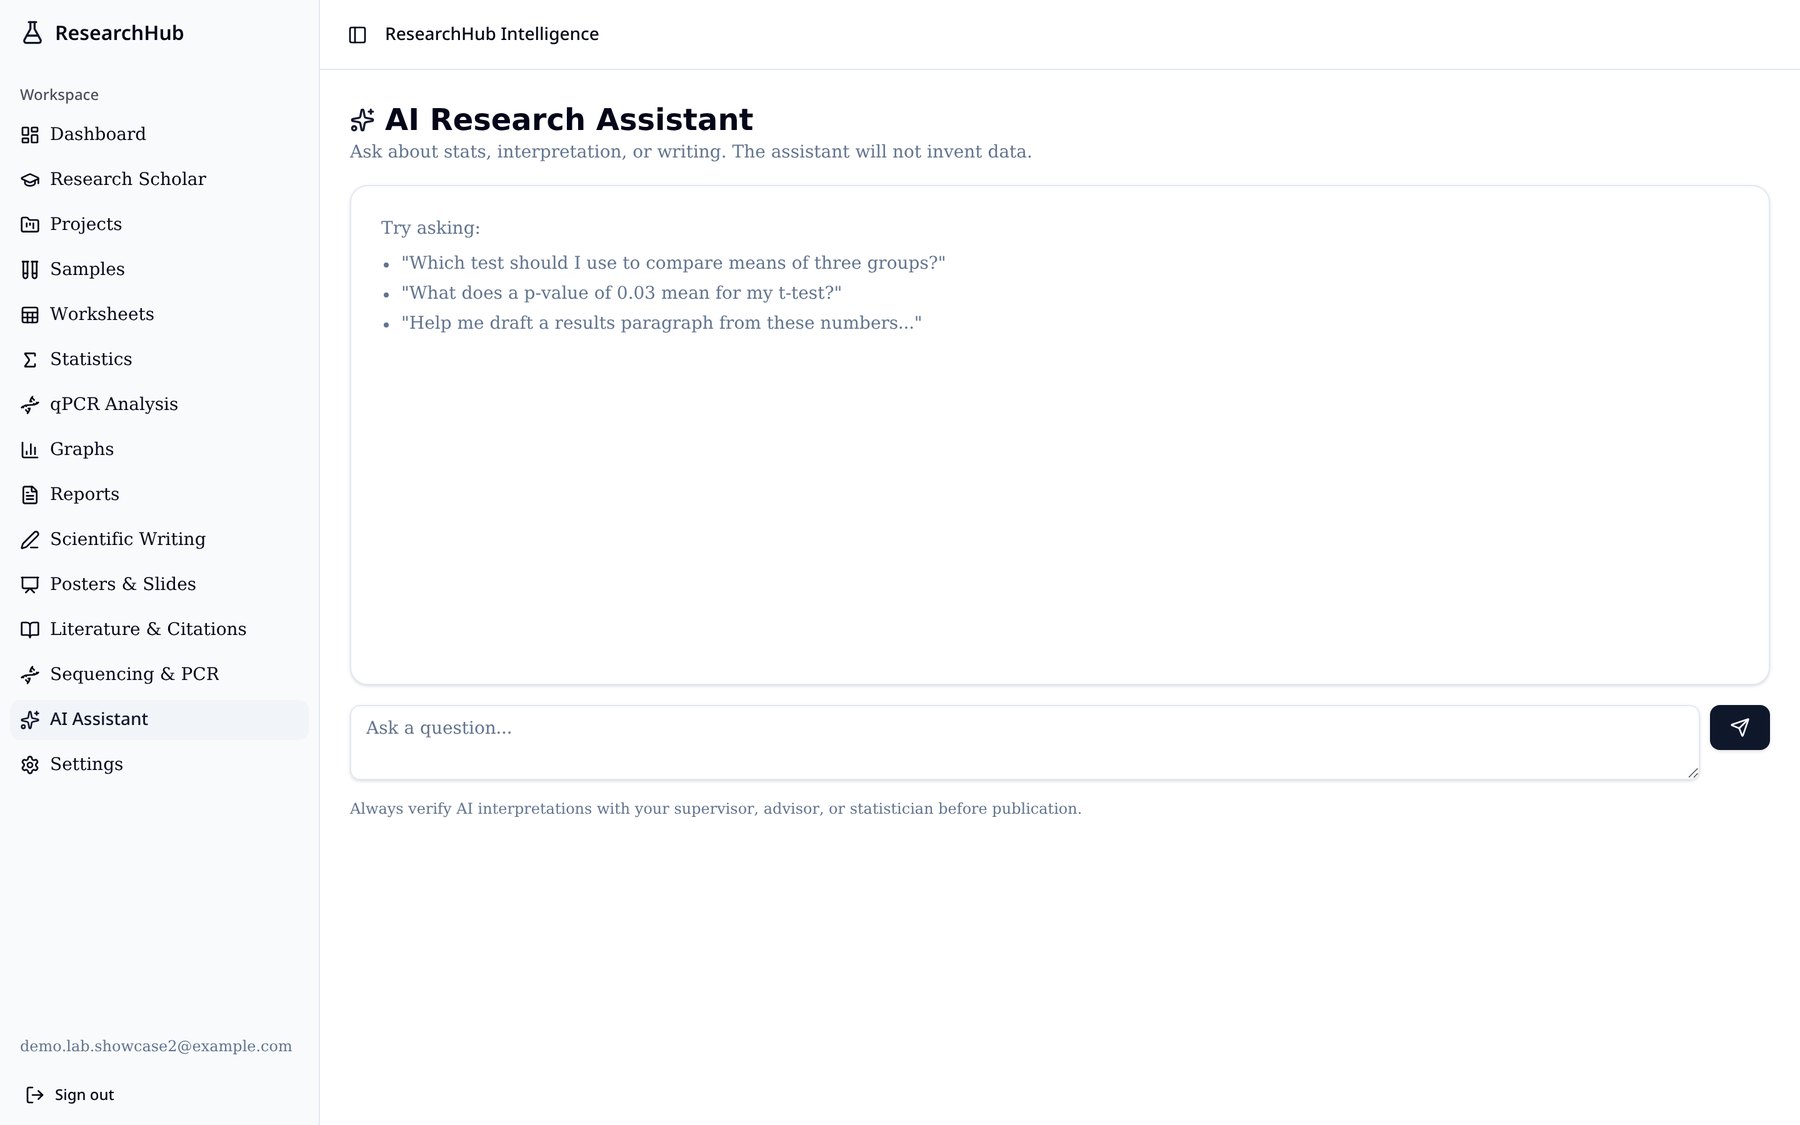
Ask which test fits your design, how to report a result, or how to phrase a methods section. Every answer works from your context — placeholders appear where your numbers belong.

  • Study design and test selection help
  • Methodology and discussion drafting
  • Never fabricates numbers or citations
AI assistant in ResearchHub explaining which statistical test to use for a two-factor experiment
Scientific Figure Studio

Turn a description or a sketch into a publication-ready figure

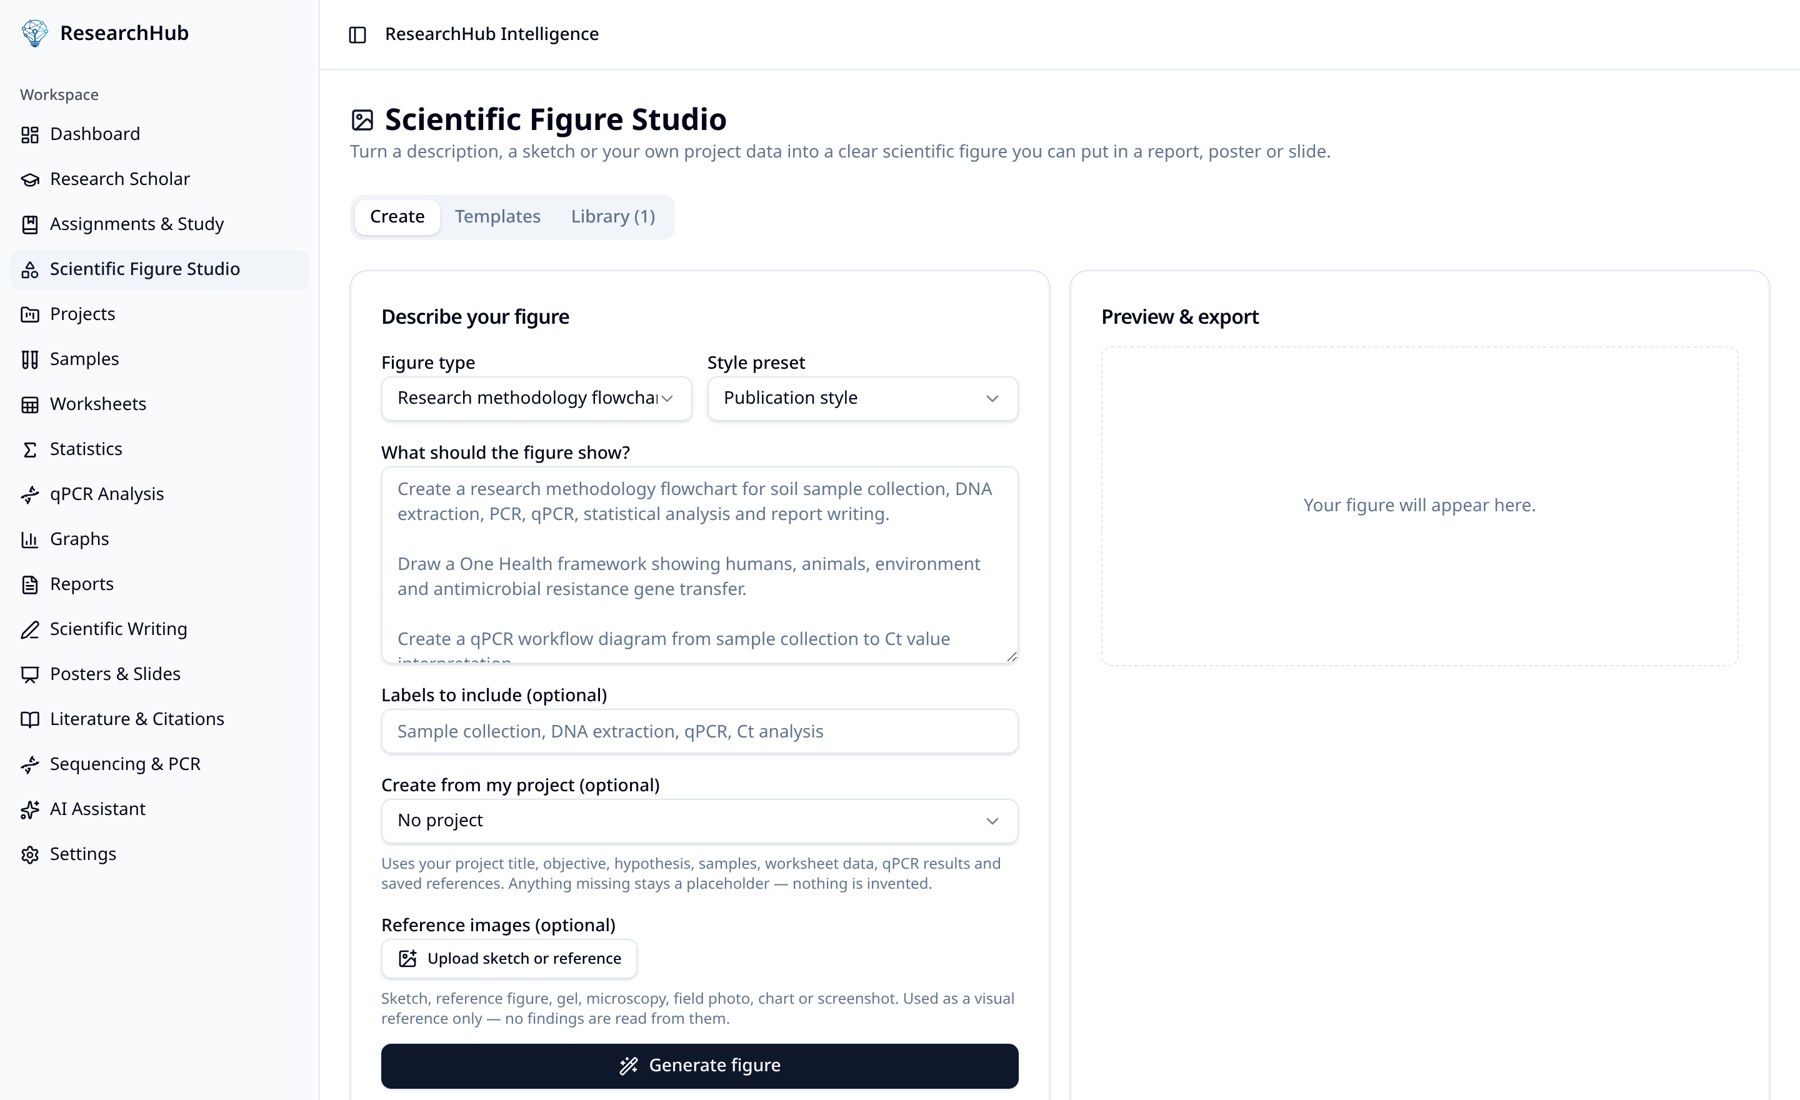
Describe the figure you need — a methodology flowchart, a labelled diagram, a circuit or a reaction scheme — or upload a rough sketch, and get a clean, labelled scientific figure you can drop straight into a report, poster or slide.

  • Flowcharts, labelled diagrams, frameworks and schematics
  • Build it from your own project: objective, methods, samples and results
  • Upload a sketch or reference image, then save every figure to your library
Scientific Figure Studio in ResearchHub with figure type, style preset, description and project options next to a figure preview panel
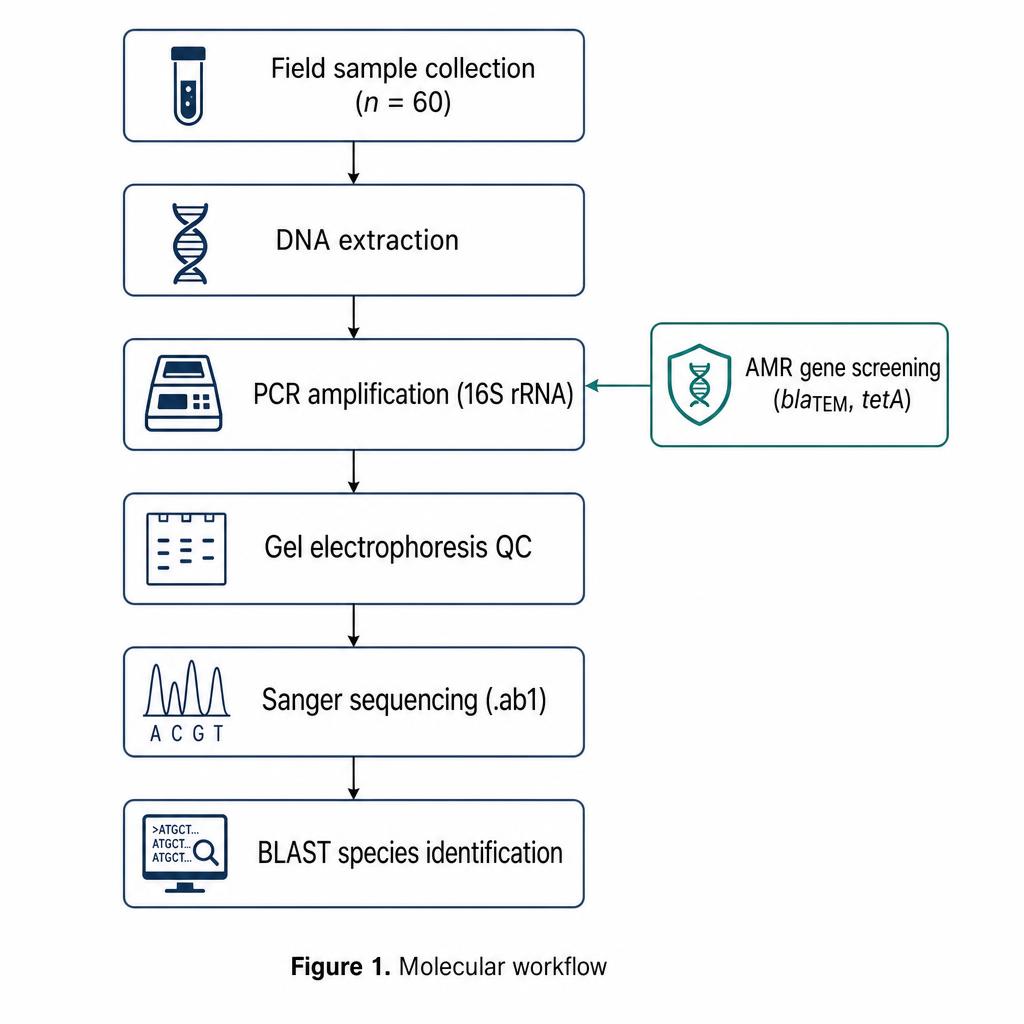
Example figure generated in ResearchHub: a molecular workflow flowchart from field sample collection through DNA extraction, PCR, gel QC, Sanger sequencing and BLAST species identification, with an AMR gene screening branch
Example output — generated from a one-line description in Figure Studio
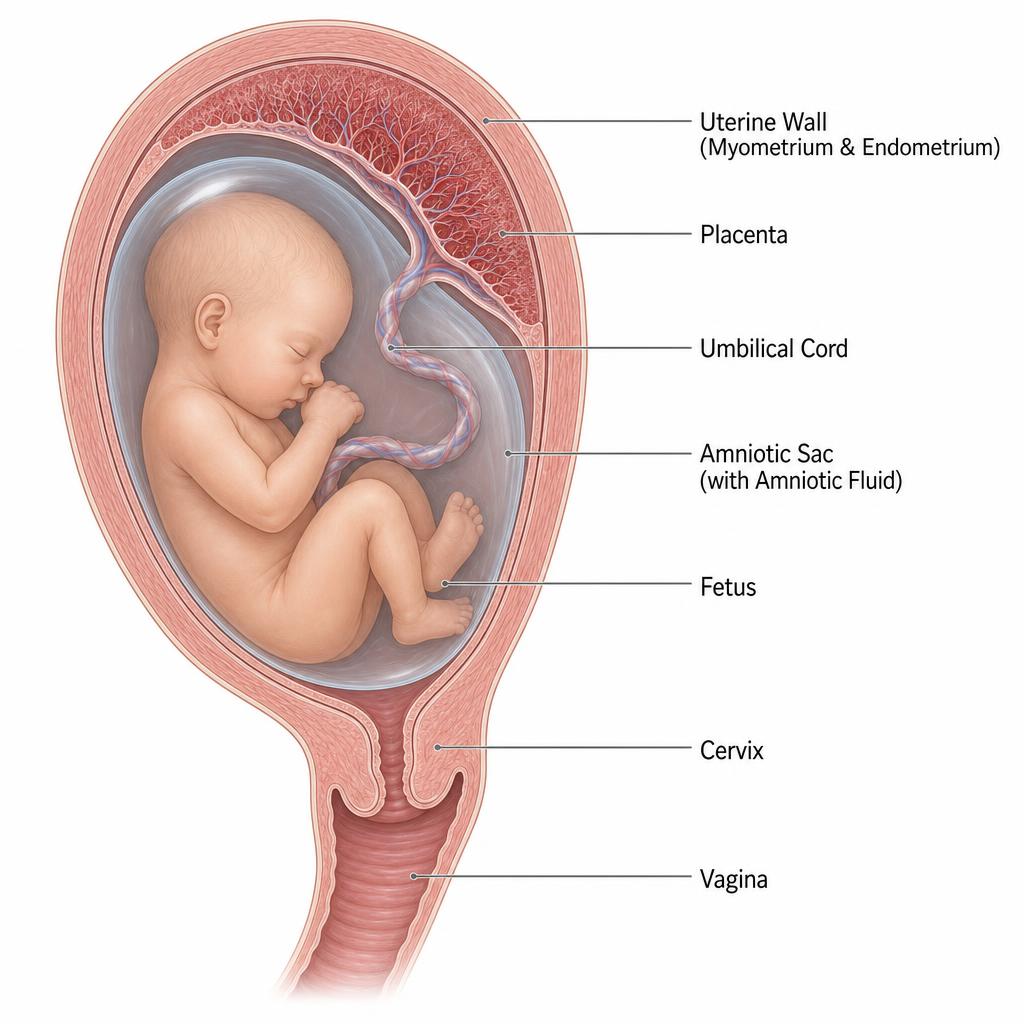
Example figure generated in ResearchHub: labelled anatomical cross-section of a fetus in the womb showing uterine wall, placenta, umbilical cord, amniotic sac, fetus, cervix and vagina
Labelled anatomy diagram — also made from a single description

And the specialist tools too

Sequencing & PCR

Parse .ab1 traces, BLAST for species ID, and screen hits for resistance genes.

qPCR analysis

Ct replicates, standard curves, ΔCt relative abundance and QC warnings.

Reports & writing

Draft methodology and discussion sections, then save them to your project.

Sharing & roles

Invite collaborators by link with researcher, supervisor or lab manager roles.

Private by default

Your data is scoped to you and the people you explicitly invite.

Any discipline

Biology, agriculture, environment, chemistry, engineering and public health.

Research Scholar

Workflow planning, modelling and analyst modes grounded in your project.

Assignments & study

Coursework support that explains research terms in plain language.

Saved and exportable

Every draft, figure, chart and report is saved and re-openable, with PDF and Word export.

Start with your next experiment

Create a project, drop in your data, and have a poster-ready result before your next lab meeting.